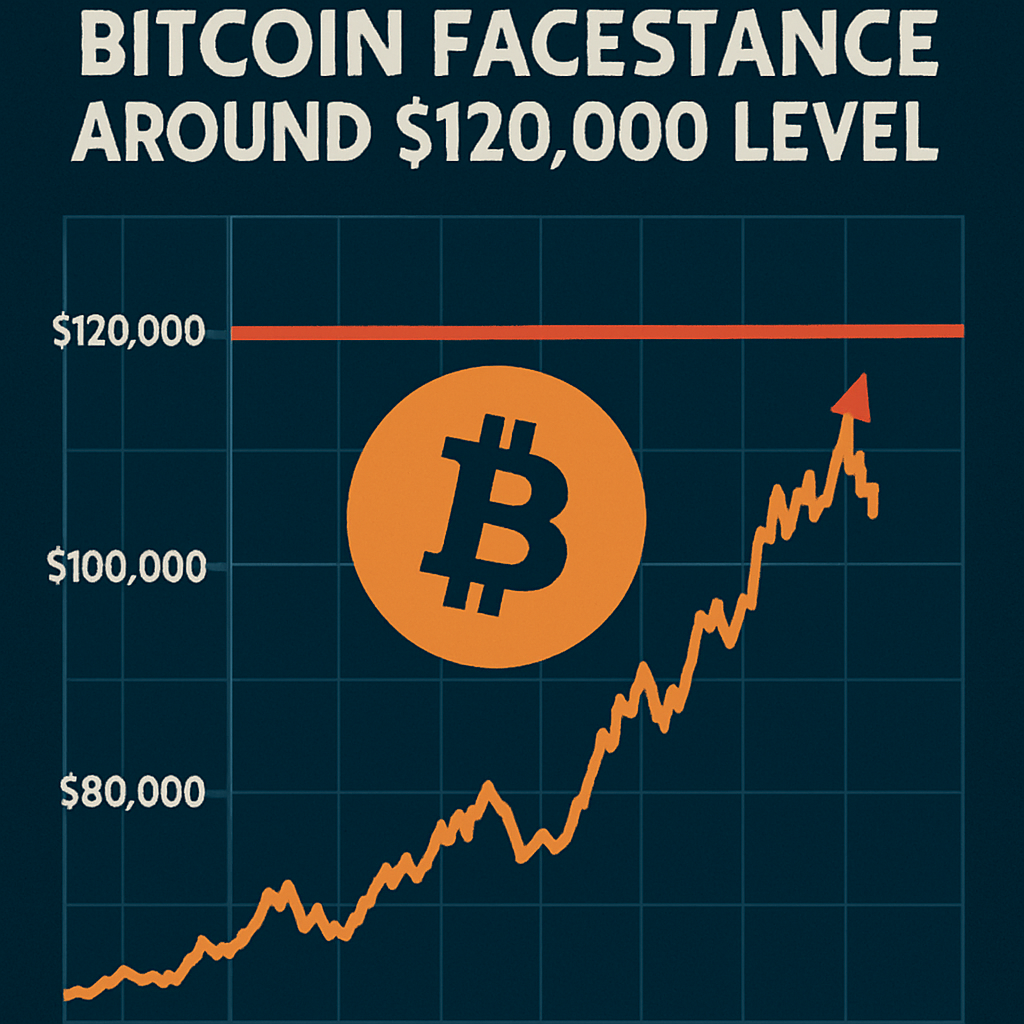
Technical charts indicate that Bitcoin encountered a significant resistance barrier near the $120,000 price level during recent intraday trading. Candlestick patterns revealed rejection wicks at this threshold, suggesting supply pressure from profit-taking and short entries by market participants. Price action remained above the 50-period exponential moving average (EMA50), which provided a dynamic support reference on shorter timeframes.
Relative Strength Index (RSI) readings dipped into oversold territory as selling volume spiked during the resistance test. Historically, RSI values below 30 have corresponded with local price rebounds, particularly when combined with moving average confluence. On-chain metrics showed reduced net position changes among exchange-held wallets, indicating a cautious stance by larger holders.
Volume profile analysis highlighted notable order book accumulation zones at $118,500 and $121,200, each marked by high bid and ask concentrations. Absorption of sell orders in these areas will be required to clear a path toward new all-time highs. Meanwhile, derivative market data revealed elevated funding rates on perpetual contracts, signalling short-term bullish sentiment despite recent price pullback.
Market depth at key support points suggests that aggressive buying interest may emerge between $118,000 and $119,500. Transaction volume within this range historically coincided with liquidity replenishment phases following volatility spikes. Custom indicator overlays, such as the Bollinger Band squeeze, illustrated contraction in price volatility, often preceding breakout events in either direction.
Macro factors, including US inflation data and central bank policy anticipation, continue to influence Bitcoin behaviour. Speculation on potential rate cuts later in the year has underpinned bullish narratives, while regulatory developments in major jurisdictions exert intermittent pressure. Correlation with tech equity indices remained moderate, indicating a degree of market independence.
Analysts recommend monitoring daily candle closes relative to the $120,000 threshold. A decisive break above that level, confirmed by sustained volume and convergence of momentum indicators, could initiate the next leg of the bullish cycle. Failure to breach resistance may lead to a retest of EMA50 support and consolidation within a defined range.
Comments (0)