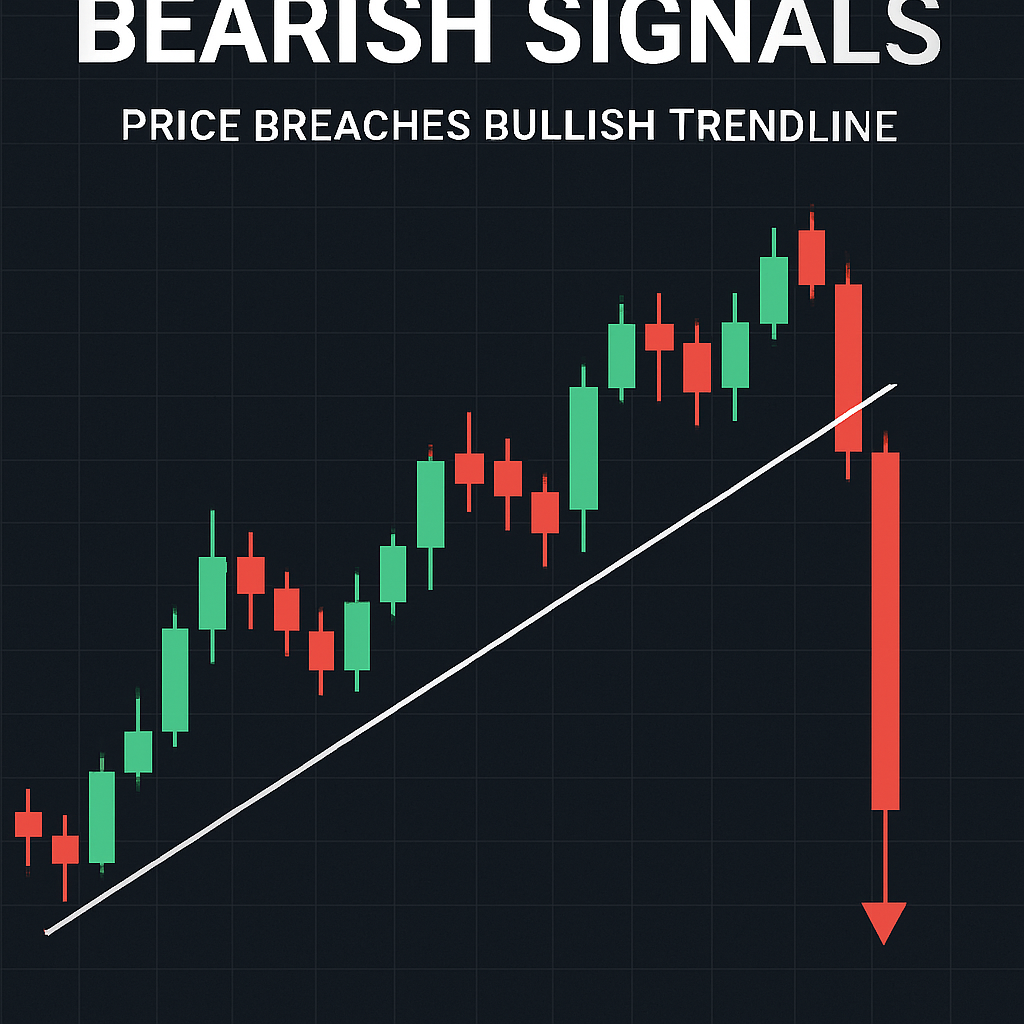
On August 18, 2025, technical analysis of Bitcoin’s price action indicated a potential bearish shift after key support levels were breached. The weekly stochastic oscillator—a momentum indicator comparing closing prices to their trading range—has rolled down from overbought territory above 80, suggesting sellers may dominate in the near term. Concurrently, Bitcoin’s candlestick chart closed below a long-term ascending trendline that linked historical highs from 2017 and 2021, a signal often interpreted as a weakening bullish structure.
After peaking above $124,000 earlier in the month, Bitcoin fell over 7%, retracing below $115,000. On the daily chart, Friday’s bearish outside-day candle—where the high exceeded the prior session’s high but the close fell below the previous low—provided an early warning of shifting sentiment. The breach of the $122,056 Fibonacci retracement level (61.8% of the April-August rally) and subsequent decline below the April trendline support intensified sell-side momentum.
Chartists note critical support levels at $111,982—the April low that preceded a swift rebound—and $105,295, corresponding to the 31.8% Fibonacci retracement of the April–August rally. A sustained violation of these zones could prompt a retest of the 200-day simple moving average near $100,000, a widely watched gauge of long-term trend direction. Conversely, a reversal above Sunday’s high near $118,600 would weaken the bearish case and potentially signal a resumption of upward momentum.
Monthly returns data from CoinGlass shows Bitcoin up 2.1% in August, slightly above the historical average of 1.8%, but seasonal strength may be limited if the price correction extends into September, which has historically delivered an average drawdown of 3.8%. Trader sentiment surveys reveal a growing proportion of market participants adopting neutral to bearish positions, aligning with the technical outlook.
Derivatives markets echo the cautious sentiment: funding rates on perpetual futures turned negative as shorts gained the upper hand, and open interest on upside strikes in BTC options declined markedly, indicating reduced speculative bullish bets. Institutional derivatives desks report elevated hedging activity around the $115,000 mark, underscoring the importance of this level as a make-or-break zone for market direction.
Looking forward, upcoming U.S. economic data releases—including consumer price index and labor figures—may influence risk appetite. Should macro indicators surprise to the upside, volatility could increase, but the technical framework suggests a period of consolidation or deeper correction may unfold before another sustained rally emerges in Q4.

Comments (0)