Bitcoin (BTC) experienced a modest recovery into the closing of the weekly candle, trading back above the $111,000 mark after dipping earlier in the weekend. Data from trading platforms show that the digital asset reached a local high of $111,369 before consolidation set in. The recovery follows U.S. macroeconomic data releases that introduced short-term volatility into crypto markets.
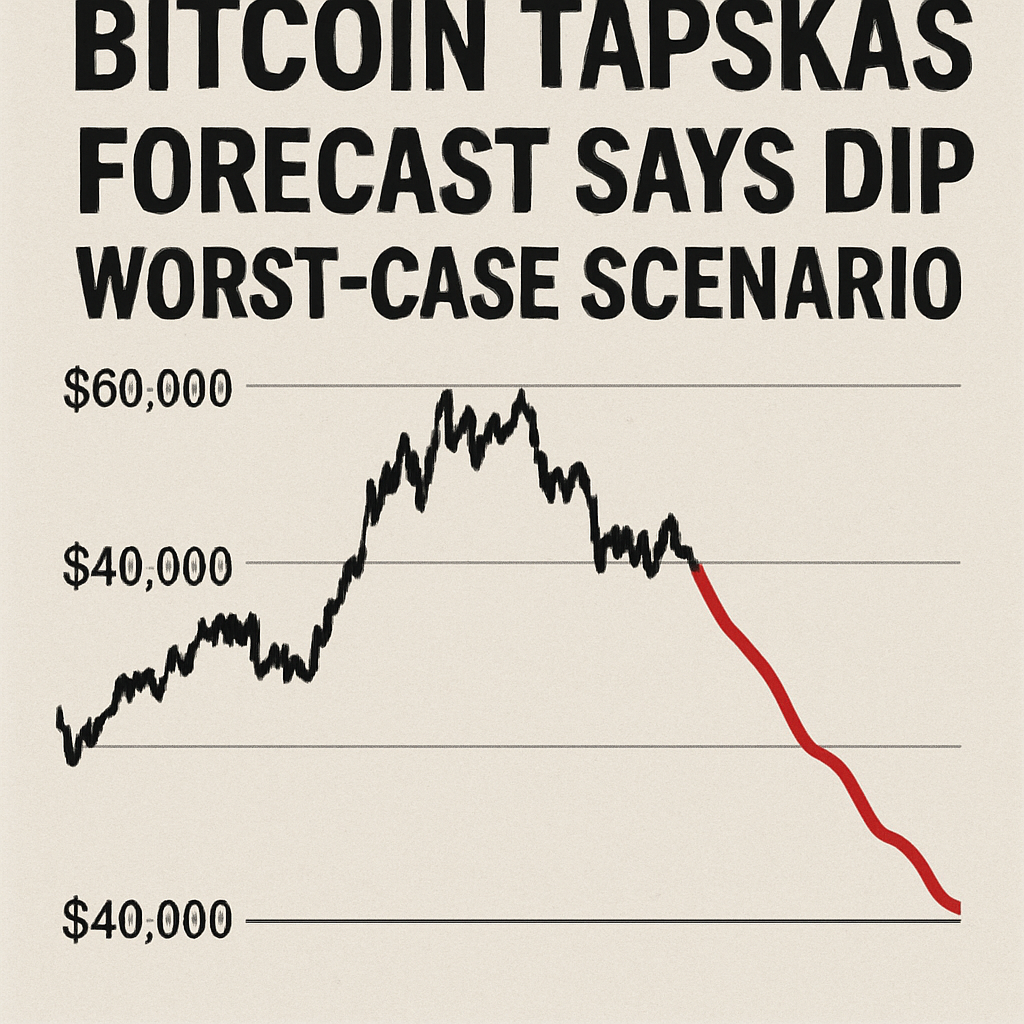
Technical analysis using Fibonacci retracement levels indicates that a significant price support may lie near the 38.2% retracement of the prior rally. Historical price movements since late 2024 demonstrate that BTC often finds a “logical” bounce zone around this level. Should Bitcoin fail to maintain its current support, the retracement suggests a potential decline toward the $100,000 threshold, marking a maximum drawdown of approximately 10% from recent highs.
Traders on social media platforms remain divided on the momentum outlook. One prominent analyst noted that breaking above $112,000 could ignite a renewed bullish trend, whereas rejection at that level might precipitate a pullback into the projected retracement zone. Market participants also cited the importance of the 50-day and 200-day simple moving averages, currently positioned near $115,035 and $101,760 respectively, as critical reference points for trend validation.
On the one-hour chart, price action reveals a series of higher lows and hints at building upward momentum. However, short-term resistance clusters around $112,000 reflect liquidity pools where sellers may be active. If bulls gain control above this zone, the path toward all-time highs could reopen, although market risk remains elevated in the absence of sustained buyer conviction.
Meanwhile, broader crypto market sentiment appears cautious. Alternative market indicators, such as the Crypto Fear & Greed Index, have recently shifted into neutral territory following periods of heightened bullish enthusiasm. This suggests traders are increasingly weighing downside risks against the backdrop of rising institutional engagement in Bitcoin ETFs and treasury allocations.
Divergent views persist regarding the trajectory of the next major move. Some analysts argue that a deeper correction is necessary to shake out weak hands and establish a firmer base for a long-term uptrend. Others maintain that the current support levels and macro drivers—such as ETF inflows and corporate treasury interest—could limit downside and set the stage for renewed upside momentum.
In summary, Bitcoin’s price action has entered a decision zone between key Fibonacci and moving average supports near $100,000 and critical resistance at $112,000. Market participants are closely monitoring on-chain signals and order-book dynamics to gauge whether the asset will confirm a bullish continuation or undergo a corrective phase toward its retracement targets. Regardless of the immediate outcome, the prevailing themes of institutional adoption and macro trends continue to exert significant influence over BTC’s medium-term price trajectory.

Comments (0)