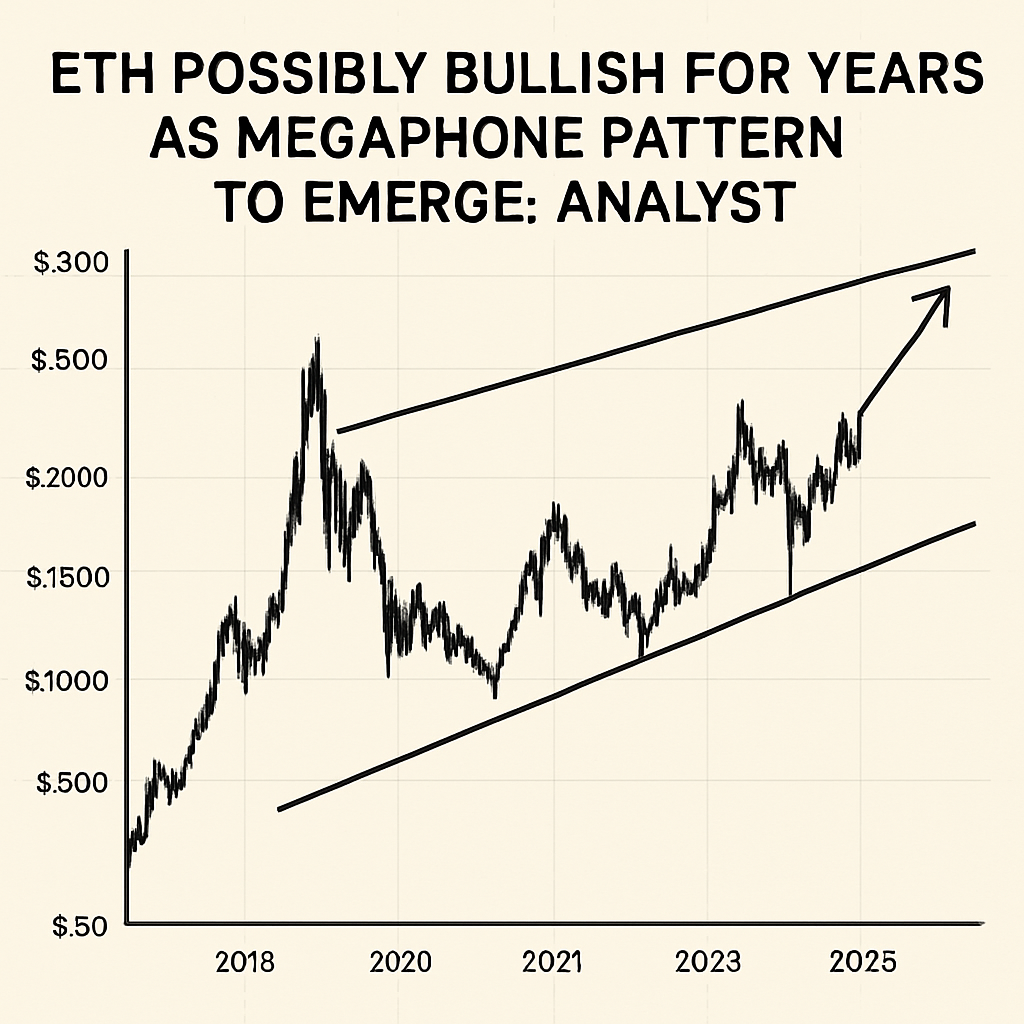
Ethereum’s price chart has formed a broadening or “megaphone” pattern, characterized by progressively higher highs and lower lows on the weekly timeframe. Technical analyst Jelle highlighted this formation in a recent X post, noting that a decisive breakout above $5,000 could ignite a sustained rally toward the $10,000 level.
Megaphone patterns indicate increased volatility and market participation at extreme price swings. When confirmed, such breakouts often trigger explosive rallies as liquidity trapped in short positions is released. CoinGlass data shows an estimated $5 billion in cumulative short positions set to unwind if Ether clears the $5,000 resistance zone.
Conversely, failure to breach $5,000 could lead to a pullback toward key support near the 12-week simple moving average around $3,500 or the lower pattern boundary near $3,000. Analysts emphasize the importance of volume confirmation, warning that weak trading participation may result in false breakouts.
Long-term perspective from analyst Jackis argues that Ethereum is entering a multi-year bullish cycle, having broken out of a 4.5-year accumulation range in December 2024. Historical trends suggest that structural expansions often follow extended consolidation periods, reinforcing the narrative of prolonged upside ahead.
Institutional onchain data also reflects growing participation, with large addresses increasing supply accumulation above the 2021 all-time highs. Ecoinometrics reports that while Ether’s correlation with Bitcoin remains elevated, its relative outperformance in recent sessions signals divergent strength among altcoins.
Market watchers point to upcoming protocol updates, macroeconomic factors and growing interest in onchain data services as potential catalysts. Sustained acceptance above prior peaks, combined with robust volume, would validate the megaphone pattern and could propel Ether toward the five-figure mark over the next several quarters.
Comments (0)