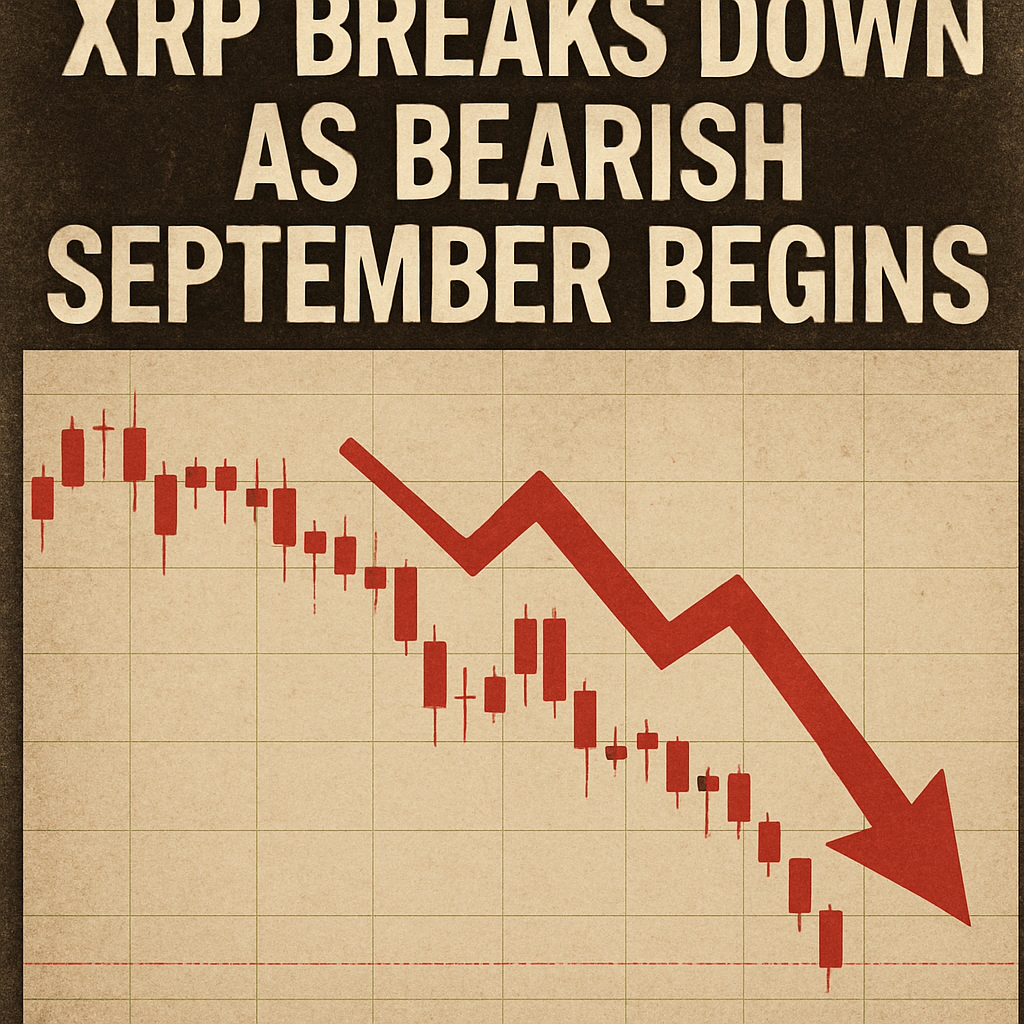
24-Hour Price Decline
XRP slipped below the $2.80 level in the early hours of September 1, falling from $2.85 to $2.75 and marking a 4% loss in the 24-hour session. Trading volumes spiked during breakdowns, with a peak of nearly 77 million tokens exchanged at the $2.80 zone—almost three times the average daily flow. The swift move triggered stop-loss liquidations, exacerbating the descent as short-term traders exited positions.
Institutional Liquidation vs. Whale Accumulation
Since July, institutional outflows have totaled approximately $1.9 billion, reflecting large-scale liquidation events that weighed on prices. In contrast, on-chain data shows a divergence as long-term holders increased their positions by 340 million XRP over the past two weeks. This contradictory behavior underscores differing market drivers: forced selling by yield-hungry entities versus opportunistic accumulation by major wallets.
Seasonal and Regulatory Backdrop
September typically ushers in a period of underperformance for crypto markets, and XRP is no exception. Historical patterns show average declines of 3–5% in September, a trend tied to macroeconomic factors and rebalancing ahead of year-end. Additionally, ongoing regulatory uncertainties in the U.S., including unresolved SEC actions, continue to weigh on institutional capital allocations to XRP and other assets.
Technical Analysis and Patterns
Technical indicators signal oversold conditions, with the Relative Strength Index dipping into mid-40 territory and MACD histogram compression hinting at a potential bullish crossover. Price formed a symmetrical triangle on intra-day charts, a pattern that often precedes sharp moves once boundary levels are breached. Liquidity maps indicate clustered buy orders up to the $4.00 mark, offering insight into potential upside targets if resistance breaks occur.
Key Support and Resistance Levels
Immediate support lies at $2.75–$2.77, while deeper floors are identified at $2.50 and $2.00. On the upside, sellers have defended the $2.80–$2.87 zone, with a breakout above $2.87 paving the path toward $3.30. Momentum metrics suggest that a sustained move above $2.87 could trigger a reversal toward the higher end of the triangle formation.
Outlook and Trader Focus
Market participants are watching whether $2.75 can serve as a reliable floor heading into September’s trading sessions. A decisive breach could invite further sell pressure, while reclaiming and holding above $2.87 may shift bias toward accumulating rallies. Divergence between large-scale liquidations and whale buying underlines a pivotal inflection point that will shape short-term direction.

Comments (0)